Product Analytics from Scratch
Becoming Data-driven
Being a data-driven product team is critical to being competitive in the modern digital product marketplace.[1][2] However, many teams tend to overweight the importance of technology adoption, relative to culture and process change, in efforts to become more data-driven.[3]
Thus, product teams should begin their data-driven transformation by firstly buying into and applying current best practices in digital product analytics. And, then only secondarily, adopting modern data tools that facilitate and accelerate that transformation.
Optimizing the User Journey
The vision for any product is to delight users and make money in the process. There are many ways to measure how well teams and their products are achieving this vision, however, more than likely these measures will be lagging indicators, which are downstream measures of success that are difficult to control and not helpful guides for product development.
One example is product revenue, an obvious indicator of success but, by itself, doesn’t indicate what teams should do to improve it. More useful are leading indicators: measures that are more directly influenced by product improvements and ideally correlate well with lagging indicators.
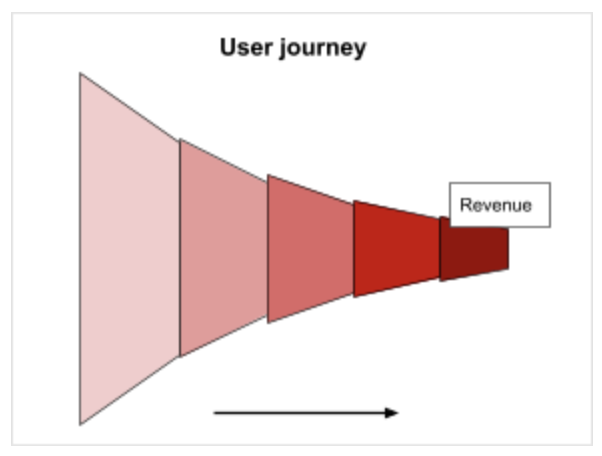
A technique commonly used to develop leading indicators in consumer applications is user journey mapping. The idea is to map out the steps users complete to get to a successful outcome, often depicted as a funnel (since apps should be designed to “funnel” users towards the desired outcome). An example might look like this:
Pirates?!
One popular approach to defining the stage of a user journey is the “AARRR!” framework (also known as the Pirate metrics framework), where each letter in the acronym represents a step in the customer journey: acquisition, activation, retention, referral and revenue.[4]
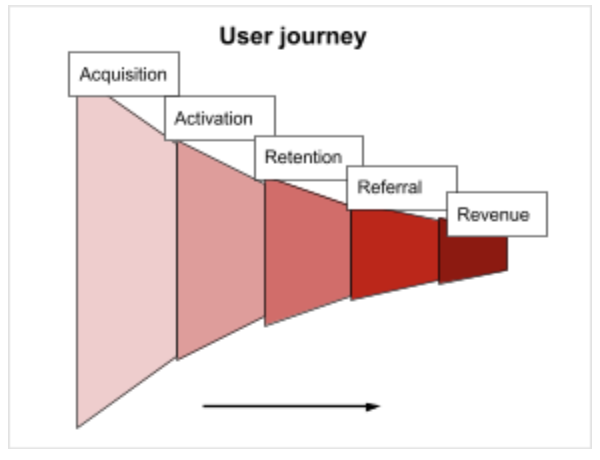
Using this framework, we now have a clearer, more mechanistic picture of how we can increase revenue over time. If the team adds features that increase user retention, those users will be more likely to refer other users and then eventually more likely to contribute to revenue, which ultimately will lead to positive outcomes for the product and company.
From here, the would want to develop and operationalize specific measures at each of these stages, which can then be used to gauge how product changes impact performance at each stage. For this, we lean on another 5-step framework.
Let’s Talk Numbers
One well-known 5-step process for developing successful metrics is as follows: define, measure, analyze, improve and control. Called DMAIC for short, this is a Six Sigma process improvement method and was adopted by Amazon to develop metrics across their various business units.[5]
Importantly, this is an end-to-end process not only for defining and implementing metrics up front but also for continuously refining the definitions and implementations until they successfully aid product improvement, which in this case means they successfully correlate product improvements with leading indicators and leading with lagging indicators.
Define
The purpose of this step is to define how metrics quantify customer behavior at each user journey stage. This step is basically the mock-up design stage of analytics development.
| Stage | Metric | Definition | Expected Rate |
| Acquisition | Visitor | Visits landing page | 100% |
| Acquisition | Happy visitor | Views 3+ pages, stays 30+ sec and clicks 3+ buttons | 40% |
| Activation | Registered | Completes user onboarding | 5% |
| Retention | Repeat visitor | 3+ visits in first 30 days | 3% |
| Retention | Weekly visitor | Completes weekly session 50%+ of weeks | 2% |
| Retention | Daily visitor | Completes daily session 25%+ of days | 1% |
| Referral | Recommender | Refer 1+ user who visits the site | 1% |
| Revenue | Paying customer | Monthly or yearly paid subscriber | <1% |
Measure
This step is performed by the data engineering/ product team, where data engineers develop software that accurately and reliably implements these measurements. A recent trend in this space is to leverage technologies now commonly referred to as the “modern data stack”, rather than developing tools in-house.
Side note: The modern data stack, or MDS, is a modular architecture built using cloud-based, open-source, usually managed solutions and is becoming the standard approach to implementing product analytics quickly and reliably, since home-grown systems can be expensive to develop and maintain.[6]
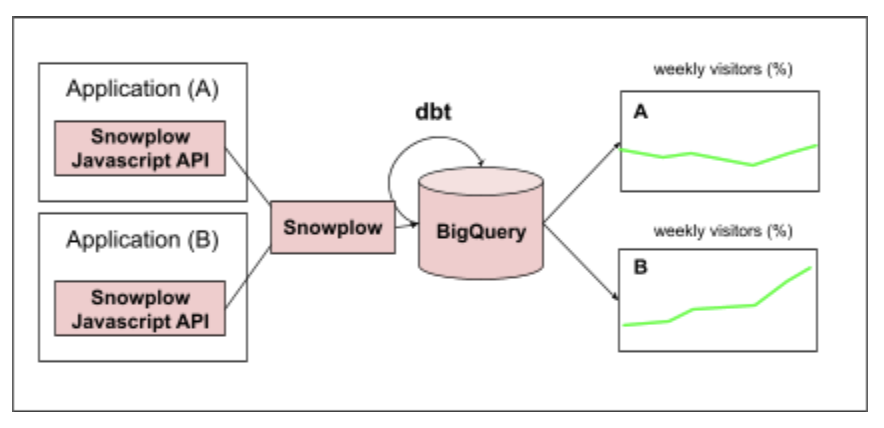
For implementing measurements, MDS tools that could be used are: Snowplow[7] for tracking user behavior events in applications, BigQuery[8] for storing data in a data warehouse and dbt[9] for data transformations. An example implementation of the “weekly visitor” metric might look like:
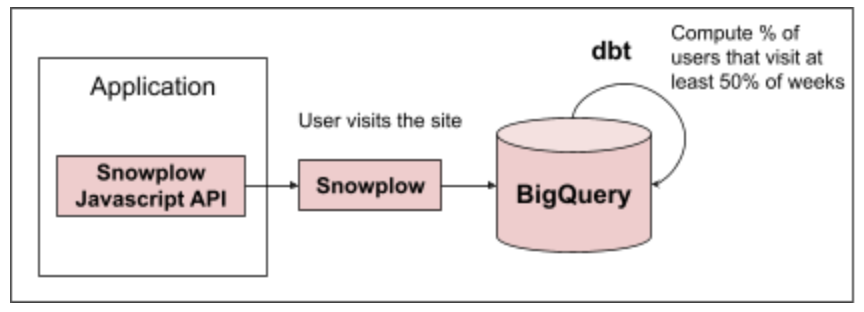
The nice part about using tools like Snowplow is they have built-in functionality for dealing with data quality issues, allowing users to define data schema and validation checks. It automatically saves records that fail these checks so data analysts can go back, analyze and diagnose why these failures might be happening.
Analyze
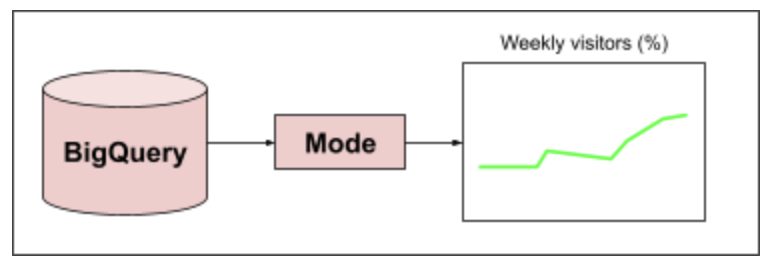
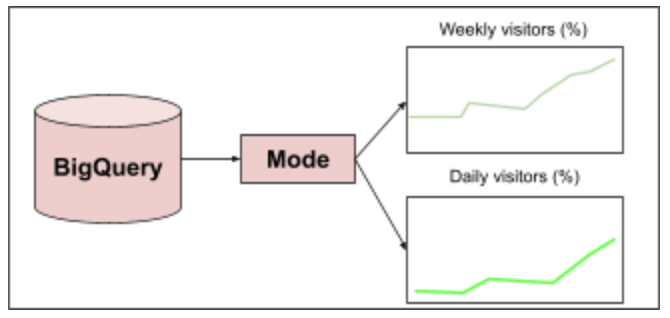
This step is all about deeply understanding all factors that influence a metric implementation. To do this, typically a team will implement a dashboard and data visualization layer so they can observe metrics over time and begin to ask questions about them. The technologies commonly used at this layer are Looker[10] or Mode[11]. An example implementation would look something like this:
A common occurrence at this stage is to encounter bugs or issues with the data, and to initiate a correction of error process (another best practice used at Amazon) to investigate the root cause of the issue and address that cause directly to improve quality.[12]
Another aspect to this step is to understand how metrics differ over time between different cohorts of users–for example, age and location demographics–which can be very useful for increasing user retention.[13]
Improve
In contrast to the prior step, the purpose of this step is to understand relationships between metrics, rather than examining them in isolation. Specifically, the goal is to understand how leading (or upstream) metrics impact lagging (or downstream) metrics. For example, the data product team might implement a dashboard visualizing both weekly and daily visitors to get a sense whether there is a correlation between the two metrics.
This functionality can be used to understand what leading indicators are the best predictors of revenue, the most important lagging indicator. If no current metrics serve this function, then additional metrics should be developed and tested in subsequent iterations.
When a company and product team get to a certain level of maturity, another important aspect to this stage is experimentation, or oftentimes called A/B testing. The idea is to understand how updating the product UI/ UX might influence certain metrics. Experimentation is a nuanced process that requires coordination between product, analytics and data science teams. There are modern tools that can simplify the process a bit (e.g. Amplitude Experiment[14]), but in general experimentation requires a large amount of cross-coordination.
Control
In the final step of the DMAIC process, the goal is to demonstrate that the team can control and manipulate specific lagging indicators by changing or experimenting with certain leading metrics. In short, to operationalize product analytics. One interesting part of this step, now possible with MDS tooling, could be to implement so-called “reverse ETL” to export metrics and other data back into upstream product marketing and engagement tools (e.g. MailChimp) for the purposes of increasing user engagement, retention and improving marketing.[15]
Part of this step can also involve adding additional automation to the data system such that data quality and reliability indicators are tracked clearly in dashboards and operationalized into notifications, where applicable.
Conclusion
To sum up, the highest impact analytics practice product teams can adopt is to map/ define, measure and analyze its users’ journeys. With that, the highest value data product is one that measures and analyzes changes in user journey metrics as they relate to each other, which can ultimately be used to increase retention and revenue. In terms of prioritization, user retention seem most likely to have the highest direct impact on revenue and so should be prioritized for experimentation and control.
In terms of data system architecture and implementation, the industry is quickly coming to a consensus that the “modern data stack” is the best approach for implementing reliable product analytics systems, especially for lean teams. As product teams progress in their effort to become more data-driven, they should adopt these tools opportunistically to facilitate and accelerate their data transformations.